
Eine dokumentierte Risikoматrix – üblicherweise ein 5×5-Raster, das Eintrittswahrscheinlichkeit und Auswirkung gegeneinander bewertet – ist eine anerkannte und praxistaugliche Methode zur Priorisierung von Informationssicherheitsrisiken unter ISO 27001. Auditoren interessiert nicht, ob Sie 5×5 oder 4×4 verwenden; sie achten darauf, ob Ihre Methodik schriftlich festgehalten, konsistent angewendet und auf Ihre Annex-A-Kontrollen sowie die Erklärung zur Anwendbarkeit zurückverfolgbar ist. Wer diese drei Anforderungen erfüllt, hat bei der Matrix selbst das Schwierigste bereits hinter sich.
Kurzfassung:
- Eine dokumentierte 5×5-Risikoматrix reicht für die ISO 27001-Konformität aus, sofern sie klar definiert, konsistent angewendet und auf Kontrollen sowie die Erklärung zur Anwendbarkeit zurückverfolgbar ist.
- Die Wahl geeigneter Skalen und Stufen – üblicherweise zwischen 4×4 und 5×5 – balanciert Granularität und Bewerterübereinstimmung, besonders wenn die Auswirkungskriterien auf branchenspezifische Risiken zugeschnitten sind.
- Der Risikobewertungsprozess muss Matrixgröße, Eintrittswahrscheinlichkeit, Auswirkungsdefinitionen, Risikoakzeptanzkriterien, Bewertungsfrequenz, Risikoeigentümer sowie die Identifizierung von Bedrohungen und Schwachstellen festlegen – mit regelmäßigen Aktualisierungen nach wesentlichen Änderungen.
- Die Bewertung sollte sich auf das inhärente Risiko vor Kontrollen konzentrieren; das Restrisiko dient dazu, die Wirksamkeit von Kontrollen und Behandlungsentscheidungen im Einklang mit dokumentierten Akzeptanzschwellen zu begründen.
- Risikobehandlungspläne und Annex-A-Zuordnungen müssen präzise auf Risiken rückführbar sein, mit dokumentierten Managementfreigaben für Restrisiken oberhalb der Akzeptanzschwellen, um Auditvorgaben zu erfüllen.
Inhaltsverzeichnis
- Was ist eine ISO 27001-Risikoматrix und wann sollte man sie einsetzen?
- Skalen und Matrixdesign wählen: 5×5, 4×4 und darüber hinaus
- Die Matrix Schritt für Schritt gemäß Abschnitt 6.1.2 aufbauen
- Bewertungen in Behandlungsentscheidungen und ein Annex-A-Mapping überführen
- Risikoregister und Behandlungsplan strukturieren
- Eine ausgearbeitete 5×5-Matrix zum Anpassen
- Wo Rechner und Benchmarks wirklich helfen
- Die Matrix auditfähig machen: Was wirklich den Unterschied macht
- Schluss mit Tabellenkalkulationsraten – mit dem Ismscalculator
- Primärquellen und weiterführende Literatur
- Quellen
Was ist eine ISO 27001-Risikoматrix und wann sollte man sie einsetzen?
Eine ISO 27001-Risikoматrix ist ein Raster, das Eintrittswahrscheinlichkeit auf einer Achse und Auswirkung auf der anderen abbildet und so eine Heatmap erzeugt, die Risiken von vernachlässigbar bis kritisch einordnet. Multipliziert man beide Werte, erhält man einen Risikowert, der sich sortieren, vergleichen und im Zeitverlauf verfolgen lässt. Es ist dieselbe Logik, die Projektmanager seit Jahrzehnten kennen – übernommen und für die Informationssicherheitsarbeit formalisiert.
Die Matrix verdient ihren Platz in einem ISO 27001-Programm, weil sie zwingt, jedes Risiko an demselben Maßstab zu messen. Ohne diese Disziplin bewertet ein Risikoverantwortlicher ein Phishing-Szenario aus dem Bauch heraus als „hoch", während ein anderer ein nahezu identisches Szenario als „mittel" einschätzt, weil er gerade eine gute Woche hatte. Eine Matrix mit definierten Stufen beseitigt diese Inkonsistenz – oder reduziert sie zumindest auf ein vertretbares Maß.
Die Auswirkungsbewertung lässt sich natürlich auf die CIA-Triade abbilden: Vertraulichkeit, Integrität und Verfügbarkeit. Ein Ransomware-Szenario trifft beispielsweise die Verfügbarkeit hart (Systeme fallen aus) und kann auch die Integrität beeinträchtigen (Daten werden beschädigt, bevor man es bemerkt). Ein falsch konfigurierter Cloud-Speicher-Bucket ist fast ausschließlich ein Vertraulichkeitsproblem. Wer alle drei Dimensionen bewertet, statt nur eine einzige gemischte Zahl für „wie schlimm ist das" zu vergeben, hält sein Risikoregister ehrlich darüber, was tatsächlich ausfällt, wenn eine Bedrohung eintritt.
Matrizen sind nicht die einzige Risikobewertungsmethode, die ISO 27001 zulässt. Die Norm schreibt ausdrücklich keine Technik vor. Quantitative Modelle mit annualisiertem Erwartungsschaden (ALE), Monte-Carlo-Simulationen und FAIR (Factor Analysis of Information Risk) erfüllen alle denselben Abschnitt. Warum landen die meisten Organisationen – insbesondere kleine und mittelgroße – dennoch bei einer Matrix?
- Sie skaliert mit einem wachsenden Asset-Inventar, ohne dass jeder Risikoverantwortliche statistische Kenntnisse benötigt.
- Sie liefert Ergebnisse, die nichttechnische Stakeholder und Auditoren auf einen Blick lesen können.
- Sie ist bei Jahresüberprüfungen wiederholbar – was einer Zertifizierungsstelle wichtiger ist als mathematische Präzision.
- Sie ist im Vergleich zu quantitativen Modellen, die Schadensdaten voraussetzen, die die meisten Unternehmen gar nicht haben, günstig aufzubauen und zu pflegen.
Wählen Sie eine Matrix, wenn Ihre Risikopopulation breit ist (Dutzende bis Hunderte von Szenarien aus IT, HR, physischer Sicherheit und Drittparteien) und Sie eine Methode benötigen, die ein Compliance-Beauftragter, ein IT-Manager und ein externer Auditor gleichermaßen interpretieren können. Behalten Sie quantitative Modelle den wenigen hochgewichtigen Risiken vor, bei denen das Management einen konkreten Schadensbetrag sehen möchte.
Skalen und Matrixdesign wählen: 5×5, 4×4 und darüber hinaus
Die 5×5-Matrix (fünf Wahrscheinlichkeitsstufen mal fünf Auswirkungsstufen, jeweils von 1 bis 5 bewertet) ist der Standard in den meisten ISO 27001-Implementierungen – und das aus gutem Grund. Ein dokumentierter 5×5-Ansatz mit definierten Akzeptanzbändern liefert Auditoren genau das, was sie erwarten: genug Granularität, um Risiken aussagekräftig zu differenzieren, ohne so viele Stufen, dass sich zwei Bewerter nicht mehr auf eine Einordnung einigen können.
Numerische Skalen (1 bis 5) und beschriftete Skalen (selten, unwahrscheinlich, möglich, wahrscheinlich, fast sicher) funktionieren beide, lösen aber unterschiedliche Probleme. Numerische Skalen lassen sich sauber zu einem einzigen Risikowert multiplizieren, was die meisten Heatmaps und Risikoregister erwarten. Beschriftete Skalen lesen sich in Vorstandspräsentationen besser, benötigen aber eine Übersetzungstabelle in Zahlen, bevor man etwas sortieren kann. Die meisten reifen Programme nutzen beides: Beschriftungen für die Erzählung, Zahlen für die Mathematik.
So gehen Sie bei der Auswahl und Definition Ihrer Skala vor:
- Zuerst die Matrixgröße festlegen. Eine 5×5-Matrix funktioniert für die meisten mittelgroßen Organisationen; eine 4×4 eignet sich für kleinere Teams, die Schwierigkeiten haben, fünf Abstufungen zuverlässig zu unterscheiden.
- Für jede Stufe auf beiden Achsen eine einzige Definition formulieren. „Eintrittswahrscheinlichkeit 3: könnte plausiblerweise einmal in den nächsten 12 Monaten eintreten, basierend auf Branchenvorfallsdaten oder früheren internen Ereignissen" schlägt „mittel" jedes Mal, wenn ein Auditor einen Risikoverantwortlichen nach der Begründung einer Bewertung fragt.
- Auswirkungskriterien an geschäftlichen Konsequenzen ausrichten, nicht nur an technischen. Finanzschwellen, regulatorisches Bußgeldrisiko, vertragliche Strafen und Ausfallzeit-Schwellenwerte übersetzen technisches Risiko in eine Sprache, die das Management tatsächlich versteht und unterzeichnet.
- Die Skala an zehn realen Risiken erproben, bevor man sie ausrollt. Wenn drei verschiedene Prüfer dasselbe Szenario zwei Stufen auseinander einordnen, sind die Definitionen zu vage.
- Die Skala im Risikobewertungsdokument festschreiben und nur durch einen formellen Überprüfungsprozess ändern – niemals mitten in einem Bewertungszyklus.
Der Kompromiss, mit dem jedes Team ringt, ist Granularität versus Konsistenz. Eine 7×7-Matrix wirkt auf dem Papier beeindruckend präzise, aber wenn man fünf Risikoverantwortliche bittet, „Wahrscheinlichkeit 4" und „Wahrscheinlichkeit 5" über 49 Felder hinweg unabhängig voneinander zu unterscheiden, erhält man mehr Meinungsverschiedenheiten als Daten. Gröbere Skalen opfern Nuancen, gewinnen dafür aber etwas Wertvolleres im Audit: Bewerter, die die Kriterien jedes Mal gleich anwenden.
Praxis-Tipp: Passen Sie Ihre Auswirkungsskala vor allem anderen an Ihre Branche an. Die „kritische" Auswirkungsstufe eines Gesundheitsdienstleisters sollte auf Patientensicherheit und HIPAA-Haftung verweisen; die eines Versicherers auf Versicherungsnehmerdaten und aufsichtsrechtliche Kapitalanforderungen. Eine generische, aus einer Vorlage kopierte Skala bildet selten das ab, worüber Ihr Vorstand tatsächlich nachts wacht.
Die Matrix Schritt für Schritt gemäß Abschnitt 6.1.2 aufbauen
Abschnitt 6.1.2 der ISO/IEC 27001 verlangt, einen dokumentierten Informationssicherheits-Risikobewertungsprozess zu definieren und anzuwenden – einschließlich Risikoakzeptanzkriterien und Kriterien für die Durchführung der Bewertungen selbst. Diese eine Anforderung treibt fast alles an, was ein Auditor später prüft; es lohnt sich daher, sie als Checkliste zu behandeln, nicht als Empfehlung.
Bevor Sie ein einziges Risiko bewerten, muss Ihre dokumentierte Methodik Folgendes festlegen:
- Die Matrixgröße und die Definition jeder Wahrscheinlichkeits- und Auswirkungsstufe.
- Risikoakzeptanzkriterien (der Wert, oberhalb dessen ein Risiko Behandlung erfordert, nicht nur Überwachung).
- Bewertungsfrequenz (jährlich ist Standard; häufiger in Umgebungen mit hohem Änderungsrate).
- Wer den Prozess verantwortet, wer einzelne Risiken besitzt und wer Akzeptanzentscheidungen genehmigt.
- Wie Assets, Bedrohungen und Schwachstellen überhaupt identifiziert werden.
Der letzte Punkt verdient besondere Aufmerksamkeit, denn hier stagnieren viele ISMS-Teams beim ersten Versuch. Beginnen Sie mit einem Asset-Inventar – Informationen, Systeme, Personen, Einrichtungen, Drittparteien – und arbeiten Sie sich nach außen vor. Führen Sie für jedes Asset eine szenariobasierte Identifikation durch: Was könnte realistischerweise schiefgehen, und welches Bedrohungs-/Schwachstellenpaar verursacht es? Ein Laptop-Bestand kombiniert die Bedrohung „Diebstahl" mit der Schwachstelle „unverschlüsselte Festplatten". Eine Kundendatenbank kombiniert „SQL-Injection" mit „ungepatchtem Anwendungscode". Für diesen Schritt brauchen Sie keine ausgefeilten Bedrohungsmodellierungsframeworks; ein strukturiertes Brainstorming gegen Ihre Asset-Liste, abgeglichen mit einem Bedrohungskatalog, deckt die meisten Organisationen ab.
Sobald Sie ein Szenario identifiziert haben, folgt die Bewertung einer einfachen Formel: Inhärentes Risiko = Eintrittswahrscheinlichkeit × Auswirkung, berechnet so, als ob noch keine Kontrollen vorhanden wären. Das ist wichtig, weil es eine Baseline schafft. Wer direkt mit Kontrollen im Kopf bewertet, unterschätzt systematisch das tatsächliche Risiko – und hat später keine Möglichkeit, die Wirksamkeit von Kontrollen nachzuweisen.
Das Restrisiko ist der Punkt, an dem bestehende Kontrollen ins Spiel kommen. Wenn Sie für den Laptop-Bestand bereits Multi-Faktor-Authentifizierung und Endpoint-Erkennung eingesetzt haben, sinkt die Eintrittswahrscheinlichkeit eines erfolgreichen diebstahlbedingten Datenlecks – vielleicht von 4 auf 2. Berechnen Sie den Wert mit derselben Formel neu, und die Lücke zwischen inhärentem und Restrisiko wird zu Ihrem Nachweis, dass Kontrollen messbar wirken. Diese Lücke ist auch das, was die meisten Compliance-Beauftragten in ihrer Bedeutung unterschätzen: Sie ist das klarste Artefakt, das Sie einem Auditor übergeben können, um zu belegen, dass Ihre Kontrollen nicht nur dokumentiert, sondern auch wirksam sind.
Mit einem Restrisikowert ist der Bewertungsschritt ein Vergleich, keine Ermessensentscheidung: Liegt der Restrisikowert ober- oder unterhalb Ihrer dokumentierten Akzeptanzkriterien? Wenn darunter, können Sie das Risiko akzeptieren und weitermachen. Wenn darüber, wählen Sie einen Behandlungspfad; gängige Behandlungsoptionen gliedern sich in vier Kategorien:
- Mindern durch Implementierung zusätzlicher Annex-A-Kontrollen.
- Übertragen des Risikos durch Versicherung oder Outsourcing.
- Vermeiden des Risikos durch Einstellung der risikoschaffenden Aktivität.
- Akzeptieren des Restrisikos, dokumentiert und formal vom Top-Management genehmigt.
Jede dieser Entscheidungen braucht einen Dokumentationspfad. Eine dokumentierte, wiederholbare Matrixmethode reduziert Auditbefunde nicht, weil ein bestimmtes Bewertungsmodell überlegen wäre, sondern weil Auditoren auf Konsistenz und Nachweise achten, nicht auf mathematische Eleganz. Ihr Risikoregistereintrag, die Genehmigungsunterlage und die Überprüfungsnotizen sind das, was tatsächlich geprüft wird. Die Matrix ist nur der Mechanismus, der die Zahl erzeugt hat.
Bewertungen in Behandlungsentscheidungen und ein Annex-A-Mapping überführen
Ein Risikowert bedeutet nichts, solange Sie nicht festlegen, was ober- und unterhalb davon zu tun ist. Die meisten Organisationen definieren drei oder vier Akzeptanzbänder, zum Beispiel: Werte von 1 bis 4 sind niedrig und werden überwacht, 5 bis 9 sind mittel und werden im nächsten Zyklus überprüft, 10 bis 15 sind hoch und erfordern einen Behandlungsplan innerhalb von 90 Tagen, und 16 bis 25 sind kritisch und verlangen sofortiges Handeln innerhalb von 30 Tagen sowie sofortige Managementbenachrichtigung.
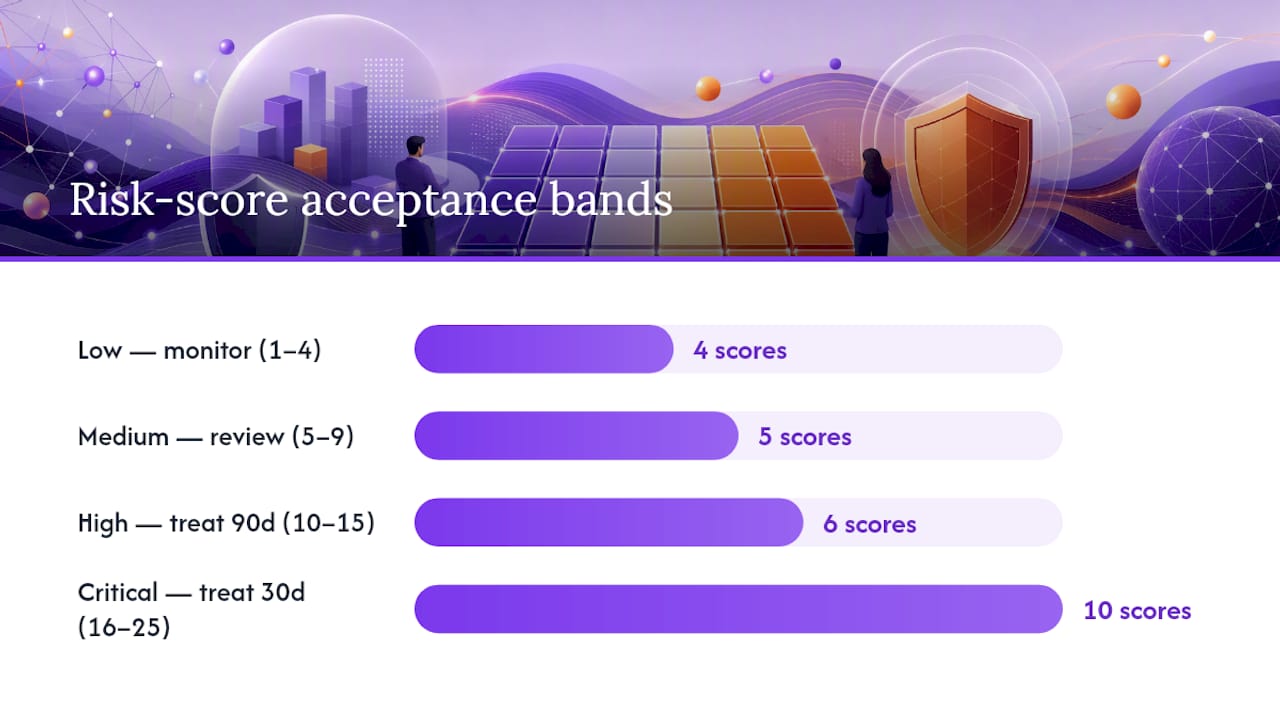
Diese genauen Schwellenwerte sind nicht heilig. Entscheidend ist, dass Sie sie festlegen, bevor Sie mit der Risikobewertung beginnen, sie in Ihrer Methodik dokumentieren und ausnahmslos anwenden. Ein häufiger Fehler ist das nachträgliche Verschieben der Akzeptanzlinie, weil das Risiko eines Lieblingsprojekts knapp darüber lag. Genau diese Art nachträglicher Rationalisierung führt zu Abweichungsbefunden, wenn ein Auditor Ihre Entscheidungen bis zu den dokumentierten Kriterien zurückverfolgt.
Sobald ein Risiko Ihre Behandlungsschwelle überschreitet, ist der nächste Schritt das Mapping auf Annex A. Annex A der ISO 27001 listet 93 Kontrollen in vier Themenbereichen auf: organisatorisch, personenbezogen, physisch und technologisch. Für jedes hohe oder kritische Risiko wählen Sie die Kontrolle oder Kontrollen aus, die es adressieren, und halten diese Auswahl – zusammen mit der Begründung für ihre Aufnahme oder ihren Ausschluss – in der Erklärung zur Anwendbarkeit (SoA) fest.
Die SoA ist die Stelle, an der viele ansonsten solide ISMS-Programme Punkte verlieren. Auditoren erwarten Rückverfolgbarkeit von jeder Annex-A-Kontrolle zu mindestens einem Risiko im Register – eine Diskrepanz zwischen beiden ist eine der am häufigsten zitierten Abweichungen in Zertifizierungsaudits. Wenn Ihre SoA A.8.24 (Einsatz von Kryptographie) als anwendbar ausweist, Ihr Risikoregister aber nie ein Szenario erwähnt, das Kryptographie mindern würde, ist das eine Lücke, die ein Auditor sofort erkennt.
Die Lösung ist verfahrenstechnisch, nicht ausgeklügelt: Bauen Sie die SoA direkt aus dem Risikoregister auf, nicht als separate Übung. Notieren Sie für jedes Risiko, das eine Behandlung erforderte, welche Annex-A-Kontrolle(n) Sie implementieren, und verweisen Sie in der Begründungsspalte der SoA auf die Risiko-ID. Der umgekehrte Weg – das nachträgliche Auffüllen von Begründungen für eine generische SoA-Vorlage – ist der Ursprung der Rückverfolgbarkeitslücke.
Auditorprüfungen folgen in diesem Bereich einem vorhersehbaren Muster:
- Mehrere hoch oder kritisch bewertete Risiken aus dem Register auswählen und den entsprechenden SoA-Eintrag anfordern.
- Mehrere „anwendbare" Kontrollen aus der SoA auswählen und fragen, welches Risiko diese Auswahl ausgelöst hat.
- Prüfen, ob ausgeschlossene Kontrollen eine dokumentierte Begründung haben, die auf einem tatsächlichen Risikobewertungsergebnis beruht – nicht auf einem pauschalen „für unseren Kontext nicht anwendbar".
- Bestätigen, dass Restrisikoacceptances oberhalb Ihrer dokumentierten Schwelle eine Managementfreigabe tragen – datiert und einer namentlich genannten Person zugeschrieben.
Dieser letzte Punkt überrascht mehr Organisationen als er sollte. Wenn Ihre Akzeptanzkriterien vorsehen, dass alles oberhalb eines Wertes von 15 eine Freigabe der Geschäftsführung benötigt, und Sie einen mit 20 bewerteten Risikoeintrag im Register haben, dem keine Unterschrift beigefügt ist, ist das keine Dokumentationskleinigkeit. Es ist ein Bruch in der Verantwortungskette, auf der die gesamte Norm aufbaut.
Risikoregister und Behandlungsplan strukturieren
Ihr Risikoregister ist das Arbeitsdokument, in das alles andere in diesem Prozess einfließt – und es muss mehr enthalten als eine Risikobeschreibung und einen Wert. Sehen Sie mindestens folgende Spalten vor:
- Eine eindeutige Risiko-ID (für Querverweise in SoA und Behandlungsplan)
- Risikobeschreibung und betroffenes Asset
- Bedrohungs-/Schwachstellenpaarung, die das Szenario erzeugt
- Inhärente Eintrittswahrscheinlichkeit, inhärente Auswirkung und inhärenter Risikowert
- Bereits implementierte Kontrollen
- Residuale Eintrittswahrscheinlichkeit, residuale Auswirkung und Restrisikobewertung
- Behandlungsentscheidung (mindern, übertragen, vermeiden, akzeptieren)
- Risikoverantwortlicher (eine namentlich genannte Person, keine Abteilung)
- Status und nächstes Überprüfungsdatum
Das Feld „Risikoverantwortlicher" verdient besondere Aufmerksamkeit. „IT-Abteilung" ist kein Risikoverantwortlicher; es ist ein Organigrammeintrag ohne zugeordnete Rechenschaftspflicht. Auditoren fragen zunehmend gezielt, wer persönlich dafür zuständig ist, ein bestimmtes Risiko bis zum Abschluss zu verfolgen – und „die IT-Abteilung" besteht diese Frage nicht. Nennen Sie eine Person.
Für jedes Risiko, das oberhalb Ihrer Akzeptanzschwelle liegt, muss der Registereintrag in einen Behandlungsplan mit eigener Struktur münden: die spezifisch zu implementierende Kontrolle, ein Meilensteindatum, die Person, die validiert, dass die Kontrolle nach der Implementierung tatsächlich wirkt (nicht nur, dass sie installiert wurde), sowie den Nachweis dieser Validierung – Screenshots, Testergebnisse, eine Richtlinienfreigabe, je nach Kontrolltyp.
Der Überprüfungsrhythmus sollte der Veränderungsrate Ihrer Risikolandschaft entsprechen. Jährliche Vollüberprüfungen sind die Basis, die jeder durchführt; ein wirklich reifes ISMS löst jedoch auch Ad-hoc-Überprüfungen nach wesentlichen Ereignissen aus: bei Inbetriebnahme eines neuen Systems, einer Übernahme, einem bedeutenden Vorfall oder einer neuen regulatorischen Anforderung. Ein volles Jahr zu warten, bevor man Risiken nach einer wesentlichen Umgebungsänderung neu bewertet, ist eine Lücke, die Auditoren schnell bemerken – weil sie darauf hindeutet, dass der Risikoprozess nach Kalender und nicht nach tatsächlichen Bedingungen gesteuert wird.
Praxis-Tipp: Führen Sie neben Ihrem Risikoregister ein kompaktes Änderungsprotokoll – nicht vergraben in Besprechungsprotokollen –, das jeden Anlass für eine außerplanmäßige Überprüfung und die daraus resultierenden Änderungen festhält. Das verwandelt „wir überprüfen jährlich" in ein nachweisbares Muster kontinuierlicher Überwachung, was im Audit eine stärkere Botschaft vermittelt als ein einziger jährlicher Schnappschuss.
Eine ausgearbeitete 5×5-Matrix zum Anpassen
Hier ist eine Standard-5×5-Heatmap mit der Eintrittswahrscheinlichkeit auf der vertikalen Achse und der Auswirkung oben quer. Multiplizieren Sie beide Werte, um den Risikowert in jeder Zelle zu erhalten.
| Wahrscheinlichkeit ↓ / Auswirkung → | 1 (Vernachlässigbar) | 2 (Geringfügig) | 3 (Moderat) | 4 (Erheblich) | 5 (Schwerwiegend) |
|---|---|---|---|---|---|
| 1 (Selten) | 1 | 2 | 3 | 4 | 5 |
| 2 (Unwahrscheinlich) | 2 | 4 | 6 | 8 | 10 |
| 3 (Möglich) | 3 | 6 | 9 | 12 | 15 |
| 4 (Wahrscheinlich) | 4 | 8 | 12 | 16 | 20 |
| 5 (Nahezu sicher) | 5 | 10 | 15 | 20 | 25 |
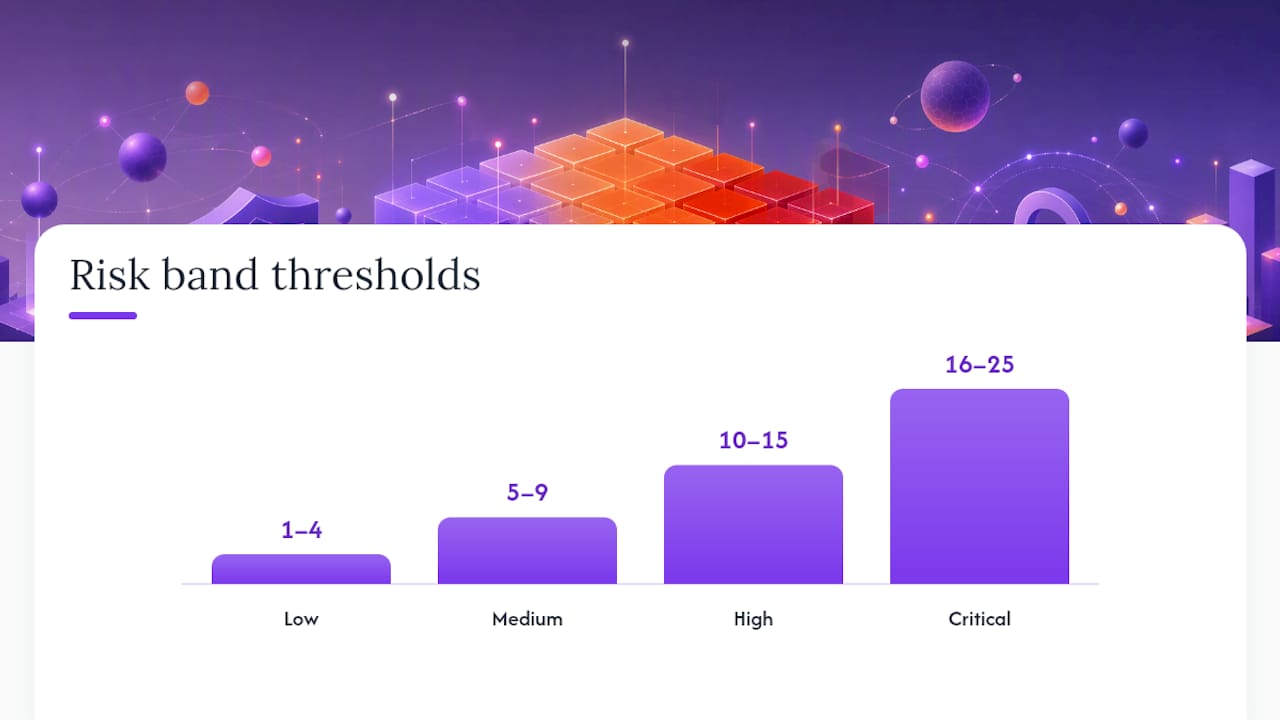
Eine häufig verwendete Bandstruktur behandelt Werte von 1 bis 4 als niedrig, 5 bis 9 als mittel, 10 bis 15 als hoch und 16 bis 25 als kritisch. Diese Bänder werden in Ihrer Methodik dokumentiert und konsistent im gesamten Register angewendet.
Hier ein vollständig ausgearbeiteter Eintrag, der den gesamten Prozess durchläuft:
Asset: Customer-Relationship-Management-Datenbank (enthält Namen, Kontaktdaten, Kaufhistorie). Bedrohung/Schwachstelle: Ein externer Angreifer nutzt eine ungepatchte Anwendungsschwachstelle aus, um Datensätze zu exfiltrieren. Inhärente Bewertung: Wahrscheinlichkeit 4 (ungepatchte Systeme sind ein wiederkehrender Befund in Schwachstellenscans) × Auswirkung 5 (regulatorische Bußgelder, Kosten der Meldepflicht, Reputationsschaden) = 20, kritisch. Bestehende und hinzugefügte Kontrollen: Web Application Firewall, vierteljährliches Patch-Management, Verschlüsselung im Ruhezustand, Zugriffsprotokollierung mit Anomaliealerting. Residuale Bewertung: Wahrscheinlichkeit sinkt auf 2 (Kontrollen reduzieren Ausnutzbarkeit erheblich) × Auswirkung bleibt bei 4 (ein Datenleck ist auch bei schnellerer Eindämmung noch kostspielig) = 8, mittel. Behandlungsentscheidung: Restrisiko akzeptieren mit einer dokumentierten halbjährlichen Überprüfung, genehmigt durch den CISO, da es nun innerhalb des mittleren Akzeptanzbandes liegt.
Die Anpassung dieser Vorlage auf verschiedene Branchen betrifft hauptsächlich die Auswirkungskriterien, nicht die Matrixmechanik. Ein Versicherer, der dasselbe Datenbankszenario bewertet, würde die Auswirkung stärker an aufsichtsrechtlichem Kapital und Versicherungsnehmer-Meldepflichten messen, was Auswirkungswerte oft höher treibt, als ein Handelsunternehmen für ein gleichwertiges Datenleck ansetzen würde. Ein fünfköpfiges Start-up könnte sinnvollerweise eine 4×4-Version dieser Tabelle verwenden, wenn eine vollständige 5×5 mehr Granularität bietet, als das Team konsistent anwenden kann.
Wo Rechner und Benchmarks wirklich helfen
Tabellenkalkulationen können eine Risikoматrix problemlos abbilden, scheitern jedoch, sobald Sie diesjährige Werte mit denen des Vorjahres vergleichen, Ihre Reife mit einer transparenten Modellreferenz abgleichen oder eine saubere SoA exportieren möchten, ohne Formelfehler über vierzig Tabs hinweg suchen zu müssen. Zweckgebundene Tools schließen diese Lücke, und Herstellerdaten zu Risikobewertungssoftware weisen konsistent auf dieselben operativen Vorteile hin: weniger manuelle Fehler, schnellerer Szenariovergleich und Berichte, die nicht jedes Quartal neu als Pivot-Tabellen aufgebaut werden müssen.
Einige Funktionen machen in der Praxis den Unterschied:
- Echtzeit-Reifegradrechner, die Implementierungskosten und -aufwand bezogen auf Unternehmensgröße und Branche schätzen.
- Reifegradbeurteilungen über die vier Annex-A-Kontrollthemen, damit Sie wissen, wo Ihr Programm Lücken hat, bevor ein Auditor sie entdeckt.
- Vorlagenbasierte Exporte, die ein Risikoregister direkt in SoA-fähige Dokumentation verwandeln.
- Gespeicherte und vergleichbare Bewertungen – nützlich, wenn die Geschäftsführung Fortschritte über Quartale hinweg sehen möchte.
Nichts davon ersetzt die dokumentierte Methodik, die Abschnitt 6.1.2 fordert, und kein Tool genehmigt die Restrisikoacceptance an Ihrer Stelle. Tools beschleunigen die Mechanik; die Urteile, die Eigentümerzuweisungen und die Managementfreigaben bleiben Aufgabe Ihres Teams.
Die Matrix auditfähig machen: Was wirklich den Unterschied macht
Die meisten ISMS-Programme, die Zertifizierungen reibungslos bestehen, sind nicht diejenigen mit dem ausgefeiltesten Bewertungsmodell. Es sind die, die ihre Akzeptanzbänder schriftlich festgelegt haben, bevor sie ein einziges Risiko bewertet haben – und die Grenzwerte danach nie still verschoben haben. Diese eine Disziplin verhindert mehr Abweichungen als jede noch so ausgeklügelte Matrix.
Einfachheit schlägt Präzision hier öfter, als man erwartet. Eine klare 5×5-Matrix mit gut definierten Stufen, die jedes Quartal auf dieselbe Weise angewendet wird, übertrifft ein aufwändiges 10×10-Modell, das drei verschiedene Risikoverantwortliche auf drei verschiedene Weisen interpretieren. Konsistenz ist das, was Auditoren tatsächlich verifizieren können; Granularität sieht in einer Präsentation meist nur beeindruckend aus.
Das letzte Element, das Praktiker unterschätzen, ist der Überprüfungsrhythmus, der an reale Ereignisse geknüpft ist – nicht an den Kalender. Ein namentlich genannter Eigentümer, eine durch eine tatsächliche Umgebungsänderung ausgelöste Überprüfung und ein Nachweis darüber, was sich zwischen den Bewertungen verändert hat, vermitteln im Audit eine weit stärkere Botschaft als ein einziger polierter Jahresschnappschuss.
— Martin
Schluss mit Tabellenkalkulationsraten – mit dem Ismscalculator
Eine Matrix von Hand zu erstellen funktioniert, aber den Gesamtumfang des ISO 27001-Projekts zu bestimmen – wie lange es dauert und was es kostet – ist ein separates Problem, für das die meisten Tabellenkalkulationen nie gemacht wurden. Ismscalculator liefert Ihnen eine Echtzeit-Schätzung, die auf Ihre Unternehmensgröße, Branche und aktuelle Sicherheitsreife zugeschnitten ist – verglichen mit einer transparenten Modellreferenz.
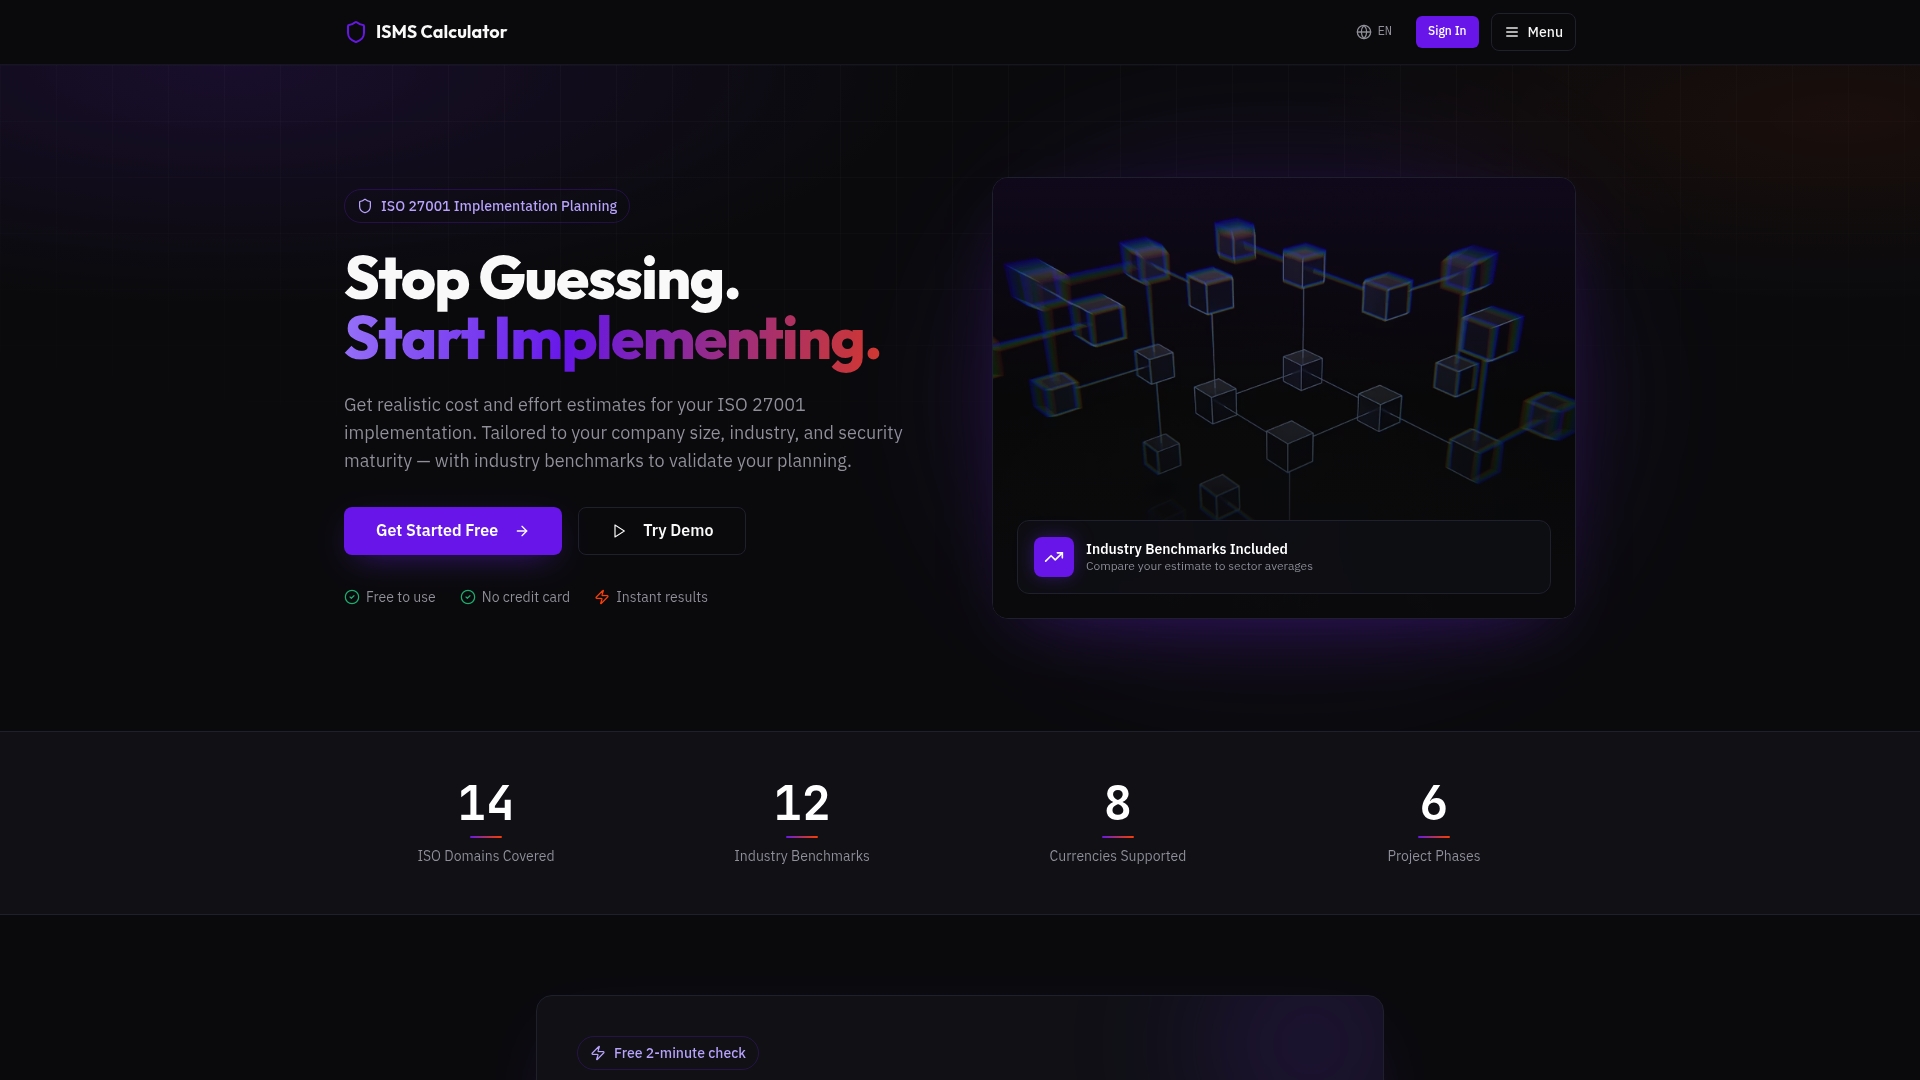
Die Plattform führt eine Reifegradbeurteilung über die vier Annex-A-Kontrollthemen durch, sodass Sie genau sehen, wo Ihre Risikomanagementpraktiken stehen, bevor ein Auditor es Ihnen mitteilt. Von dort aus legt ein anpassbares Gantt-Diagramm Ihre Implementierungsphasen fest, und Sie können Ergebnisse als PDF exportieren oder mehrere Schätzungen speichern, um Szenarien zu vergleichen, wenn sich Ihr Scope verschiebt. Es ist darauf ausgelegt, das Risikoregister und den Behandlungsplan, den Sie bereits zusammenstellen, zu ergänzen – nicht die Urteile zu ersetzen, die dabei einfließen.
Beginnen Sie mit dem kostenlosen 2-Minuten-Readiness-Check für eine erste Schätzung, oder führen Sie die vollständige ISO 27001-Readiness-Bewertung durch, wenn Sie Kosten, Zeitplan und Aufwand im Detail planen möchten.
Primärquellen und weiterführende Literatur
Für den Normwortlaut zu dokumentierten Risikobewertungsanforderungen konsultieren Sie ISO/IEC 27001:2022 direkt. Für implementierungs- und auditfokussierte Details lesen Sie den ISO 27001-Risikobehandlungsleitfaden und den vollständigen Methodikleitfaden.
Quellen
- ISO/IEC 27001:2022 – Informationssicherheits-Managementsysteme
- ISO 27001 Risikobewertungsmethodik: Ein vollständiger Leitfaden
- ISO 27001:2022 Implementierungsleitfaden für Informationssicherheit