
How to benchmark compliance costs effectively
The most direct way to benchmark compliance costs is to compare your program’s spending against both internal historical data and external industry standards, using a structured cost categorization framework. Start with these core methods:
- Define your cost categories first. Split spending into direct costs (staff, software, audits), indirect costs (management time, cross-department coordination), and opportunity costs (delayed projects, foregone revenue). The OECD Compliance Cost Assessment framework provides the most widely accepted structure for this breakdown.
- Run internal benchmarking. Compare spending across business units, geographies, or fiscal years. Year-over-year trendlines reveal whether cost increases reflect genuine regulatory growth or internal inefficiency.
- Use external benchmarking. Pull data from industry reports, regulatory body guidance, and peer surveys. The DOJ’s Compliance Program Guidance and HHS Office of Inspector General (OIG) guidelines both establish baseline expectations for program adequacy that translate into cost benchmarks.
- Incorporate regulatory framework standards. The OIG’s compliance program guidance for hospitals, for example, specifies the types of activities a compliant program must fund, giving you a floor for spending categories.
- Track all three cost types. Many programs only count direct spending. Indirect and opportunity costs often exceed direct costs in labor-intensive compliance functions.
- Benchmark in real time, not annually. Regulatory changes mid-year can shift your cost profile significantly. A quarterly review cadence keeps your benchmarks current.
Why benchmarking your compliance program costs matters
Non-compliance costs average $9.4 million across multinational organizations, compared to $3.5 million for full compliance. That 2.65x gap is the clearest financial argument for investing in compliance cost analysis. Benchmarking tells you whether your spending is positioned to prevent that gap from opening.
Beyond the financial stakes, benchmarking compliance expenses gives leadership a concrete basis for budget decisions. Without comparative data, compliance budgets tend to be set by inertia rather than risk. A benchmarked program can show exactly where spending is below peer levels and where it may be redundant.
Benchmarking also supports proactive resource allocation. Regulatory environments shift fast, and programs that only review costs annually often find themselves underfunded in newly regulated areas and overfunded in stable ones. Flat compliance spending per employee in recent years, as trend data shows, represents a real reduction in purchasing power once inflation is factored in. That squeeze makes knowing where every dollar goes more urgent, not less.
- Justifies budget requests to the CFO with peer-referenced data
- Identifies over-spending in low-risk areas that can be reallocated
- Flags under-investment in high-risk or newly regulated domains
- Creates a documented record of program adequacy for regulators
- Drives continuous improvement by tracking cost efficiency over time
Key strategies for an effective compliance benchmarking process
Define your metrics before you collect data. The most common failure in compliance cost benchmarking is starting with whatever data is easiest to pull rather than the data that answers the right questions. Align your key performance indicators with recognized frameworks: the OECD Compliance Cost Assessment (CCA) framework distinguishes direct financial costs, administrative burdens, and substantive compliance costs, each of which requires a different measurement approach.
Use activity-based costing (ABC) and shadow-costing together. The Ponemon Institute’s benchmark methodology applies ABC to segment costs into six activity centers: policy development, training, program management, data security, monitoring, and enforcement. Shadow-costing captures the indirect labor costs that never appear in a compliance budget line, such as the hours a finance manager spends supporting an audit.
Here is a practical sequence for running a benchmarking process:
- Scope the exercise. Decide which regulations, business units, and time periods you are measuring.
- Categorize costs. Apply the OECD CCA or a similar framework to sort spending into direct, indirect, and opportunity cost buckets.
- Collect internal data. Interview functional leaders across compliance, IT, legal, HR, and finance. Shadow-costing requires input from people who do not sit in the compliance department.
- Source external benchmarks. Pull from Ethisphere’s annual benchmarking reports, HCCA/OIG surveys, and DOJ guidance documents.
- Compare and gap-analyze. Map your spending against peer medians by category, not just total spend.
- Set improvement targets. Identify two or three cost categories where efficiency gains are achievable within the next budget cycle.
- Establish a review cadence. Ethisphere recommends ongoing, dynamic benchmarking rather than one-off snapshots, particularly as regulatory requirements evolve.
Assign a cross-functional team to own the process. Compliance officers rarely have full visibility into the labor costs that other departments absorb on behalf of the compliance function.
How to assess and categorize compliance costs for benchmarking
The OECD CCA framework groups compliance costs into three primary categories. Using this structure makes your data comparable to external benchmarks that follow the same taxonomy.
| Cost Category | Examples | Recurring or One-Off |
|---|---|---|
| Direct financial costs | Software licenses, audit fees, legal counsel, fines | Both |
| Administrative burden | Reporting, recordkeeping, filing, staff training time | Recurring |
| Substantive compliance costs | Process redesign, capital investment, policy development | One-off (often) |
| Indirect costs | Management oversight, cross-department coordination | Recurring |
| Opportunity costs | Delayed product launches, foregone revenue from restricted activities | Situational |
A few practical notes on this breakdown:
- Recurring vs. one-off matters for budgeting. One-off costs like a major policy overhaul distort year-over-year comparisons if not separated. Strip them out before comparing annual totals.
- Indirect costs are systematically underreported. The labor time that non-compliance staff spend supporting audits, responding to regulators, or coordinating evidence collection rarely appears in the compliance budget. Capturing it through shadow-costing changes the picture considerably.
- Opportunity costs are the hardest to quantify but often the largest. A product launch delayed six months by a regulatory review has a real cost that belongs in a full compliance cost analysis.
Benchmark studies typically show that policy development and monitoring together account for the largest share of direct compliance spending. Training costs vary widely by industry and headcount.
Pro Tip: Build a simple cost register in a spreadsheet before investing in specialized software. Getting the categories right matters more than the tool you use to track them.
Challenges and best practices in benchmarking compliance costs
The biggest structural problem in compliance cost benchmarking is siloed data. Compliance budgets capture only a fraction of total compliance spending. Legal, IT, HR, and operations all absorb compliance-related costs that never get attributed to the compliance function. Without a deliberate effort to surface those costs, your benchmarks will consistently understate true program spend.
A second challenge is inconsistent cost definitions across departments and peer organizations. When one company counts internal audit labor as a compliance cost and another does not, the resulting benchmarks are not comparable. Standardizing on a recognized framework like the OECD CCA before collecting data solves most of this problem.
The hidden cost that trips up even experienced compliance officers is what practitioners call the “coordination tax”: the labor time spent gathering evidence, chasing approvals, and managing documentation across systems. This cost rarely appears in any budget line, yet it can represent a substantial portion of total compliance labor. Automating evidence collection directly reduces this burden.
Best practices that address these challenges:
- Use a multifaceted benchmarking approach that combines internal trendlines, peer comparisons, and regulatory framework standards rather than relying on any single source
- Collect data quarterly rather than annually to catch cost shifts driven by new regulations or enforcement priorities
- Track compliance staffing ratios and technology adoption alongside dollar costs, since a sophisticated benchmarking approach covers all three dimensions
- Build a contingency reserve of approximately 15% of your compliance budget to absorb regulatory surprises without disrupting planned activities
- Distinguish between cost increases driven by expanding regulatory requirements and those driven by internal inefficiency; internal trendlines are the only way to make that distinction reliably
How to select and use compliance benchmarking tools and resources
The right tool depends on what you are benchmarking. For ISO 27001 and information security compliance specifically, Ismscalculator provides real-time cost estimates calibrated to your company size, industry, and security maturity, with a transparent model reference built in so you can sanity-check your plan against published planning assumptions. The platform covers maturity assessments across all four ISO/IEC 27001:2022 control themes, which maps directly onto the cost categorization work described above.
For broader compliance programs, the key criteria when evaluating any benchmarking tool are:
- Customizable cost frameworks. Generic templates rarely match your regulatory mix. Look for tools that let you define cost categories rather than forcing you into a preset structure.
- Real-time data access. Static annual reports go stale quickly. Platforms that pull live regulatory and industry data give you benchmarks that reflect current conditions.
- Integration with GRC systems. Benchmarking data is most useful when it feeds directly into your governance, risk, and compliance platform rather than living in a separate spreadsheet.
- Coverage of multiple compliance domains. A tool that only covers one regulation forces you to maintain parallel benchmarking processes for others.
- Automation of data collection. Compliance technology adoption is still underutilized across the industry. Programs that automate evidence gathering and cost tracking reduce the coordination tax and free compliance staff for higher-value work.
External resources worth incorporating: Ethisphere’s annual ethics and compliance benchmarking reports, HCCA/OIG joint compliance guidance, the DOJ’s Evaluation of Corporate Compliance Programs, and OECD CCA guidance documents. The Health Care Compliance Association (HCCA) and the Society of Corporate Compliance and Ethics (SCCE) both publish survey data that serves as peer benchmarks for specific industries.
Industry benchmarks and standards for compliance spending
Regulatory compliance costs account for an average of 1.34% of a firm’s total wage bill, based on NBER research covering U.S. establishments from 2002 to 2014. That figure varies substantially across industries and firm sizes. Compliance officers themselves spend approximately 34.3% of their work hours on directly regulation-related tasks, according to the same research, making labor the dominant cost driver in most programs.
The DOJ’s Evaluation of Corporate Compliance Programs sets qualitative standards that translate into resource benchmarks. A program the DOJ considers “adequately resourced” has dedicated compliance staff, a training budget, and monitoring capabilities proportionate to the company’s risk profile. The OIG compliance program guidance for hospitals specifies seven core elements, each of which carries staffing and operational cost implications that can be used as a spending floor.
Ethisphere’s benchmarking data consistently shows that top-performing ethics and compliance programs invest more in technology and less in manual processes than average programs. The ratio of compliance staff to total employees, and the ratio of technology spend to total compliance budget, are two metrics that distinguish high-maturity programs from the rest.
Compliance spending peaks as a percentage of total costs around the 500-employee threshold, after which economies of scale begin to reduce the per-employee burden. Organizations near that inflection point often find the most immediate efficiency gains from automation and process standardization.
Step-by-step process to conduct a compliance cost benchmarking analysis
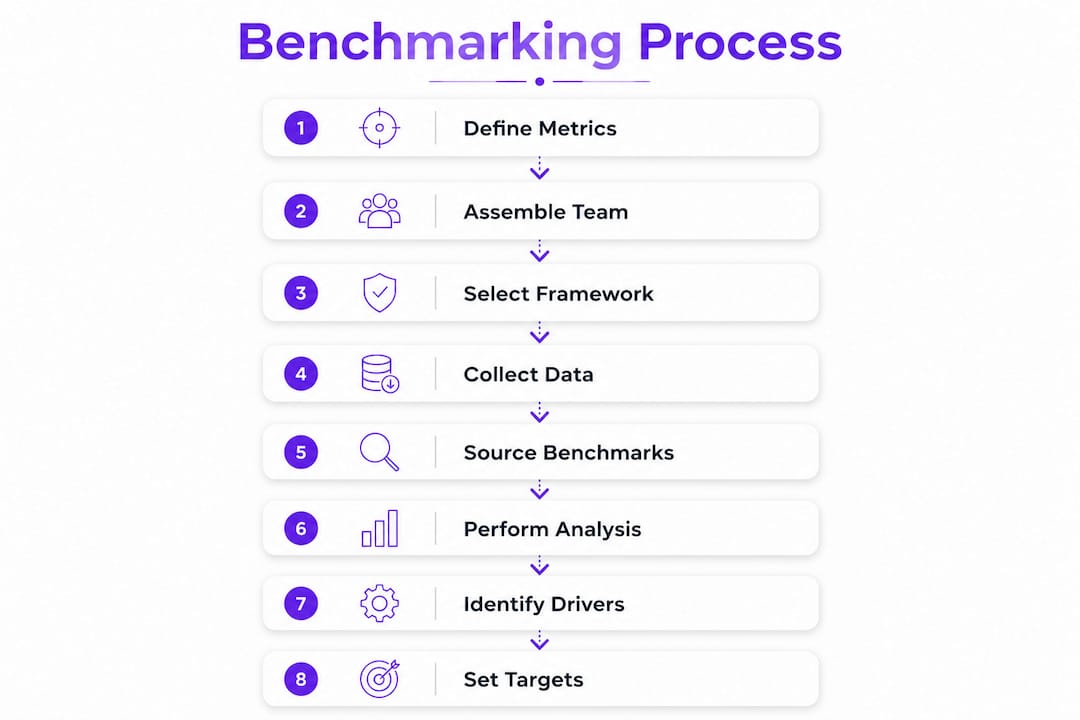
A structured benchmarking analysis follows eight steps. The sequence matters because each step builds on the previous one.
Step 1: Define scope and objectives. Decide whether you are benchmarking total program cost, a specific regulation, or a single cost category. Set a clear goal: cost reduction, risk reduction, or budget justification.
Step 2: Assemble a cross-functional team. Include representatives from compliance, legal, IT, finance, and HR. Each function holds cost data the others cannot see.
Step 3: Select your cost framework. Adopt the OECD CCA structure or a framework aligned with your industry’s regulatory requirements. Consistency with external benchmarks requires using the same taxonomy.
Step 4: Collect internal cost data. Use activity-based costing for direct costs and shadow-costing for indirect labor. Interview functional leaders rather than relying solely on accounting records.

Step 5: Source external benchmarks. Pull peer data from Ethisphere, HCCA/SCCE surveys, and regulatory guidance documents. Match your cost categories to the categories used in the external data.
Step 6: Conduct gap analysis. Compare your spending by category against peer medians and regulatory minimums. Flag categories where you are more than 20% above or below the peer range.

Step 7: Identify drivers of variance. Determine whether gaps reflect regulatory differences, efficiency differences, or data collection inconsistencies. Not every gap requires action.
Step 8: Set targets and review cadence. Establish specific cost targets for the next 12 months and schedule quarterly reviews. A real-time, multifaceted approach outperforms annual snapshots for programs operating in volatile regulatory environments.
What successful compliance cost benchmarking looks like in practice
A regional bank subject to both federal banking regulations and state-level consumer protection rules ran a shadow-costing exercise across its compliance, legal, and operations teams. The exercise revealed that operations staff were absorbing roughly 30% of the total compliance labor burden without any of that cost appearing in the compliance budget. Once captured, the true program cost was nearly double the budgeted figure. Armed with that data, the compliance officer successfully requested a technology investment to automate regulatory reporting, which reduced the operations labor burden by a measurable amount in the following year.
A mid-size healthcare organization used OIG compliance program guidance as its spending floor and Ethisphere’s industry benchmarks as its ceiling. By mapping its seven OIG program elements to specific cost categories, it identified that its training budget was well above peer levels while its monitoring and audit budget was below the OIG’s implied minimum. Reallocating from training to monitoring reduced its audit findings in the subsequent review cycle.
For technology companies navigating ISO 27001, the ISO 27001 cost benchmarking process works similarly: map implementation activities to cost categories, compare against sector averages, and identify where your spending is misaligned with your maturity level. Ismscalculator’s transparent model reference gives you a documented cost baseline to compare your own figures against, without a separate research exercise. You can also review the ISO 27001 business case to understand how benchmarked compliance spending translates into measurable return on investment.
Ismscalculator can help you compare your compliance costs with a model reference
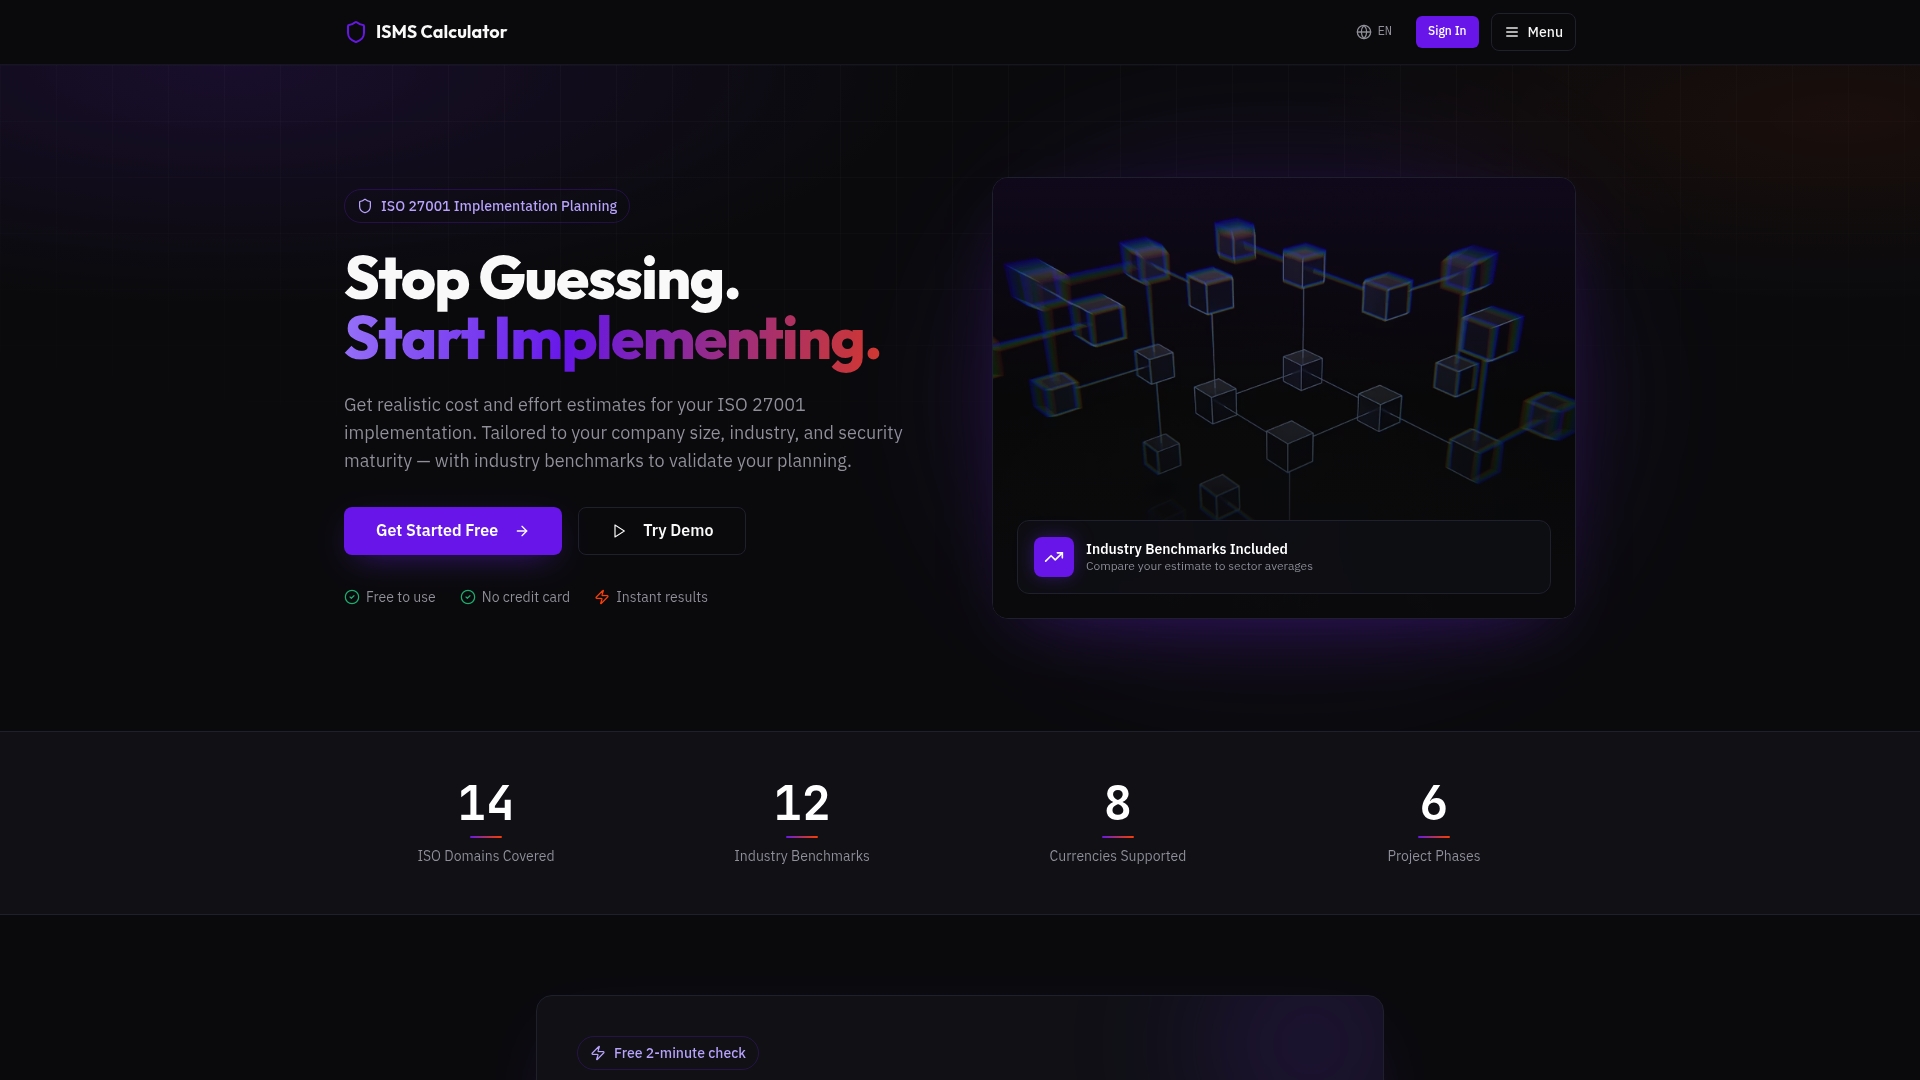
If your compliance program includes ISO 27001 or information security requirements, Ismscalculator gives you a real-time cost estimate calibrated to your company size, industry, and current security maturity. The platform’s transparent model reference lets you compare your plan with published planning assumptions without a separate research project.
Take the free 2-minute readiness check to get an immediate baseline, or run a full ISO 27001 readiness assessment to generate a detailed cost estimate you can use directly in your benchmarking analysis.
Key Takeaways
Benchmarking compliance costs against peer data and regulatory frameworks is the most reliable way to justify budgets, identify inefficiencies, and demonstrate program adequacy to regulators.
| Point | Details |
|---|---|
| Non-compliance costs 2.65x more | Average non-compliance cost is $9.4 million vs. $3.5 million for full compliance, making benchmarking a financial priority. |
| Use OECD CCA categories | Split costs into direct, administrative, and substantive categories to match external benchmarks accurately. |
| Shadow-costing captures hidden labor | Indirect compliance labor absorbed by non-compliance departments often doubles the apparent program cost. |
| Benchmark quarterly, not annually | Regulatory changes mid-year shift cost profiles; annual snapshots miss the variance that drives budget decisions. |
| 1.34% of wage bill is the baseline | NBER research puts average regulatory compliance labor at 1.34% of total firm wage costs, a useful starting reference. |