
Security benchmarks for U.S. financial institutions are operationalized, measurable targets derived from frameworks like the NIST Cybersecurity Framework, sector profiles like the CRI Cyber Profile, and regulatory programs like the FTC Safeguards Rule. They translate regulatory expectations and threat-driven test results into concrete scores your governance team can act on. If you are starting from scratch, the fastest path forward looks like this:
- Determine applicable frameworks based on your charter type, asset size, and supervisory relationships (OCC, FDIC, Fed, CFPB, SEC).
- Complete impact tiering using the CRI Cyber Profile or a comparable sector profile to calibrate assessment depth to your institution’s complexity.
- Run a baseline measurement that combines control-maturity self-assessment with at least one threat-driven test (FS Index, BAS, or penetration test).
- Map gaps to a remediation backlog with effort estimates and budget impact, then present the scorecard to your board or Qualified Individual.
That four-step cycle, tiering → inventory → baseline tests → scorecard, is the core of a first benchmark program. Everything else in this article expands on how to execute each step well.
Pro Tip: When reviewing adversary-simulation results, count a blocked technique as a partial failure if your SIEM or SOAR produced no correlated alert. Blocking without detection means your team would never know the technique was attempted in production. Treat that gap as a detection deficit, not a win.
Key Takeaways
Security benchmarks for U.S. financial institutions translate regulatory expectations and threat-driven test results into measurable, board-ready performance scores that drive remediation priorities and supervisory conversations.
| Point | Details |
|---|---|
| Start with impact tiering | Assign your CRI impact tier before mapping controls; it determines assessment depth and prevents wasted effort on disproportionate requirements. |
| Combine maturity ratings with threat-driven tests | Self-assessed maturity and FS Index or BAS scores measure different things; report them separately to avoid misleading aggregate scores. |
| 63% is the industry floor, not the target | The FS-ISAC Q1 2023 industry benchmark for threat resilience illustrates that average scores leave room for improvement, so set your target above the average. |
| Regulatory evidence is the output | Benchmark scorecards, test results, and remediation tickets are the evidence FTC Safeguards Rule examiners and FFIEC supervisors will request during exams. |
| Ismscalculator converts gap maps to budgets | Ismscalculator takes benchmark maturity scores as inputs and produces ISO 27001 effort estimates, cost ranges, and Gantt timelines for board budget requests. |
Table of Contents
- What are security benchmarks in finance, and why do they differ from standards?
- Which frameworks do U.S. financial institutions actually use?
- How do you build a benchmark-aligned assessment program?
- How do you measure security performance with scorecards and KPIs?
- Which testing techniques validate your benchmark results?
- How do benchmarks map to U.S. regulatory obligations?
- What tools and benchmark sources do security teams actually use?
- How Ismscalculator turns benchmark outputs into ISO 27001 estimates
- What does a 90-day to 12-month remediation roadmap look like?
- Where financial sector benchmarks are headed
- Ismscalculator: from benchmark gaps to ISO 27001 budget in minutes
- Sources
What are security benchmarks in finance, and why do they differ from standards?
A security benchmark is not the same thing as a standard, a control set, or a regulatory requirement, and conflating them is one of the most common mistakes compliance teams make. Here is the practical distinction:
Standards like ISO 27001 define what an information security management system must contain. They set requirements and clauses, but they do not tell you whether your detection rate is good or bad relative to peers.
Control sets like CIS Controls list which technical and operational controls to implement. They are prescriptive and prioritized, but a control being “implemented” says nothing about whether it is working.
Regulatory requirements like the FTC Safeguards Rule mandate that you have a written program, conduct risk assessments, test safeguards, and report to your board. They set a floor, not a performance target.
Benchmarks sit above all three. They take the outputs of control implementation and testing, translate them into scores or maturity ratings, and compare those scores against a defined target state or peer group.
Why financial institutions need sector-specific benchmarks
The financial sector carries a concentration of systemic risk that generic benchmarks cannot capture. A ransomware event at a mid-size payment processor can cascade through settlement networks in hours. Third-party concentration, where dozens of institutions share the same core banking vendor or cloud provider, creates correlated exposure that a standard IT benchmark would never flag. Regulators know this, which is why the FFIEC, OCC, and FDIC have historically pushed sector-specific assessment tools rather than accepting generic ISO or NIST maturity ratings alone.
Benchmarks serve four practical functions in finance: governance scorecards for board reporting, target-state mapping for multi-year programs, third-party risk tiering for vendor assessments, and supervisory conversations during exams. A well-constructed benchmark scorecard lets a CISO walk into an exam and show not just that controls exist, but that they perform at a measurable level relative to the threat environment.
A few misunderstandings worth clearing up before going further:
- Passing a benchmark is not the same as passing an audit. Benchmarks drive remediation priorities; audits verify control existence.
- A high maturity score on a self-assessment does not mean your controls are effective. Maturity ratings measure process documentation, not operational performance.
- Benchmarks should be recalibrated when the threat environment shifts, not just on an annual schedule.
- Peer comparison is useful context, but your target should be set by your own risk appetite and supervisory expectations, not by what the average institution scores.
The FS-ISAC Threat Resilience Index illustrates this well. That figure is not a target to celebrate reaching; it is a baseline that shows how much room the sector has to improve on threat-driven detection and response.
Which frameworks do U.S. financial institutions actually use?
The short answer: most institutions use more than one, and the right combination depends on your charter, size, and supervisory relationships. Here is a practical breakdown of the primary frameworks and profiles, followed by guidance on how to choose.
FFIEC Cybersecurity Assessment Tool (CAT) and its transition
The FFIEC CAT was the dominant self-assessment tool for federally supervised banks and credit unions for nearly a decade. The FFIEC announced its retirement, directing institutions to migrate to harmonized sector profiles. The CAT’s five maturity levels and domain structure influenced the design of successor tools, so familiarity with it still helps when reading older exam findings or vendor questionnaires.
NIST Cybersecurity Framework (CSF)
The NIST CSF defines five core functions: Identify, Protect, Detect, Respond, and Recover. It is the most widely used mapping backbone in U.S. finance because nearly every sector profile, including the CRI Cyber Profile and the ABA Financial Services Sector Cybersecurity Profile, cross-references it. NIST’s National Cybersecurity Center of Excellence (NCCoE) maintains a Financial Services program with sector-specific implementation examples. The CSF works best as a mapping layer rather than a standalone assessment tool; it tells you where a control lives in the framework but not how well it performs.
CRI Cyber Profile
The CRI Cyber Profile is the most practically useful sector-specific tool for U.S. financial institutions right now. It uses impact tiers (Tier 1 through Tier 4, based on systemic importance) to calibrate the number of diagnostic statements an institution must answer. A Tier 4 community bank answers far fewer statements than a Tier 1 systemically important financial institution. Critically, the CRI maps its diagnostic statements directly to NIST CSF, ISO 27001, COBIT, and other standards, which eliminates most of the duplicative assessment overhead that plagued the FFIEC CAT era. Supervisors at the OCC, FDIC, and Fed have all referenced the CRI Profile in examination guidance.
CIS Benchmarks and CIS Controls
CIS Controls provide a prioritized, implementation-group-tiered control set (IG1, IG2, IG3) that maps well to resource constraints. CIS Benchmarks go deeper, providing hardening configurations for specific operating systems, cloud platforms, and applications. For financial institutions, CIS Controls IG2 is a practical minimum for most mid-size banks; IG3 aligns with what larger institutions and their regulators expect. The CISA Cybersecurity Performance Goals checklist overlaps significantly with CIS IG1 and IG2, making it a useful cross-check.
ABA Financial Services Sector Cybersecurity Profile
The ABA profile is a community-bank-friendly adaptation of the NIST CSF, designed to reduce the assessment burden for smaller institutions. It uses a similar diagnostic-statement structure to the CRI Profile and is recognized by state banking regulators in several jurisdictions. For institutions under $1 billion in assets with limited GRC staff, the ABA profile often provides a more proportionate starting point than the full CRI Profile.
ISO 27001
ISO 27001 is an international standard for information security management systems. It is not a benchmark in the operational sense, but it provides the clause structure and Annex A control set that most sector profiles map to. Achieving ISO 27001 certification demonstrates that your ISMS meets a defined set of requirements, which carries weight in third-party risk assessments and some supervisory conversations. The effort to implement it is substantial; understanding the methodology before committing resources is worth the time.
PCI DSS
PCI DSS applies to any institution that stores, processes, or transmits cardholder data. Its control requirements are prescriptive and its assessment process (SAQ or QSA-led ROC) produces a pass/fail result rather than a maturity score. Most banks layer PCI DSS compliance on top of a broader benchmark program rather than treating it as the primary benchmark.
SOC 2
SOC 2 Type II reports are increasingly requested by financial institutions from their technology vendors and cloud service providers. For the institution itself, a SOC 2 audit can serve as evidence of control effectiveness in specific trust service criteria (security, availability, confidentiality), but it is not a substitute for a sector-specific benchmark program.
Quick signals for where to start:
- Federally supervised bank or credit union with a supervisory relationship: start with the CRI Cyber Profile and map findings to NIST CSF.
- Community institution under $1 billion in assets with limited GRC staff: start with the ABA Financial Services Sector Cybersecurity Profile or CISA CPG checklist.
- Institution pursuing ISO 27001 certification or responding to third-party vendor questionnaires: layer ISO 27001 onto your CRI or NIST baseline.
- Cardholder data environment: PCI DSS is non-negotiable; treat it as a parallel track, not a substitute for a broader benchmark program.
- Institution with a mature program looking to validate threat resilience: add the FS-ISAC Threat Resilience Index as a threat-driven overlay.
How do you build a benchmark-aligned assessment program?
The mechanics of a benchmark program are straightforward. The execution is where most institutions stumble, usually because they skip impact tiering or treat evidence collection as an afterthought.
The end-to-end assessment workflow
- Scope and inventory. Define the assessment boundary: which systems, business lines, and third parties are in scope. Build or update your asset inventory and data flow maps. Without a current inventory, your control coverage scores will be wrong.
- Impact tiering. Assign your institution to a CRI impact tier or equivalent. This step determines how many diagnostic statements you answer and how deep your evidence requirements go. Skipping tiering wastes effort on controls that are not proportionate to your complexity.
- Control mapping. Map your existing controls to the diagnostic statements or control objectives in your chosen framework. Use a GRC platform or structured spreadsheet to track control-to-statement relationships and evidence pointers.
- Baseline tests. Run at least one threat-driven test (BAS, penetration test, or FS Index) alongside your control-maturity self-assessment. The combination catches the gap between “we have a control” and “the control works.”
- Evidence collection. Gather documentation: policy documents, configuration exports, SIEM log coverage reports, vulnerability scan results, test reports, and training records. Automated evidence collection from your SIEM or vulnerability management platform saves significant time here.
- Scoring. Translate evidence into maturity ratings and performance scores. Apply consistent scoring criteria so results are comparable across assessment cycles.
- Governance reporting. Produce a scorecard for your board or Qualified Individual (as required under the FTC Safeguards Rule) and a detailed findings report for your security team.
- Remediation backlog. Prioritize gaps by risk severity and implementation effort. Assign ownership, set target dates, and track progress in your GRC or ticketing system.
Cadence and roles
Annual self-assessments are the minimum for most supervised institutions, but they are not sufficient on their own. Pair the annual cycle with quarterly vulnerability scans, monthly log coverage reviews, and continuous or semi-annual BAS runs. The Qualified Individual required under the FTC Safeguards Rule must receive a written report at least annually; many institutions now do this quarterly.
Ownership matters. The CISO or equivalent owns the overall program and the board-facing scorecard. The SOC owns detection and response metrics. GRC owns the diagnostic statement responses and evidence library. Third-party risk management owns vendor tiering and vendor assessment results. External assessors or pen testers provide independent validation.
Pro Tip: For third-party assessments, use the same impact tier model you apply internally. A Tier 1 critical vendor gets a full diagnostic-statement review and an independent test; a Tier 4 vendor gets a streamlined questionnaire. Applying the same depth to every vendor is both inefficient and misleading.
For cloud environments specifically, scope definition requires extra care. Cloud-shared responsibility models mean some controls are owned by the provider, and your evidence collection needs to reflect that boundary accurately. A cloud risk management framework helps define those boundaries before you start mapping controls.
A practical checklist for a first full-cycle program launch:
- Asset inventory and data flow maps completed and dated
- Impact tier assigned and documented with rationale
- Framework selected and diagnostic statements mapped to existing controls
- Evidence collection plan drafted with data sources and owners identified
- Baseline threat-driven test scheduled (BAS or pen test)
- Scoring criteria defined and approved by CISO
- Board reporting template drafted and reviewed by legal/compliance
- Remediation backlog format agreed with engineering and GRC leads
- Third-party assessment scope and tier assignments completed
How do you measure security performance with scorecards and KPIs?
Measurement is where benchmark programs either earn their keep or become compliance theater. The goal is a scorecard that a board member with no security background can read in five minutes and understand what the institution’s risk posture actually is.
Core scorecard dimensions
Five dimensions cover most of what supervisors and boards need to see:
- Prevention coverage: percentage of in-scope systems with up-to-date endpoint protection, patching, and hardening configurations applied.
- Detection and logging: percentage of critical assets generating logs to your SIEM, and the percentage of those logs that are actively monitored with alert rules.
- Response velocity: mean time to detect (MTTD) and mean time to respond (MTTR) for confirmed security events, trended over time.
- Remediation velocity: percentage of critical and high vulnerabilities remediated within your defined SLA windows (typically 15 days for critical, 30 days for high).
- Third-party risk posture: percentage of critical vendors with completed assessments within the past 12 months, and percentage with open high-severity findings.
Combining evidence-based tests with maturity ratings
The most common scoring mistake is averaging a high self-assessed maturity rating with a low threat-resilience test score and reporting the average. That math produces a misleading aggregate. A better approach: report maturity ratings and threat-driven test scores separately, with a brief narrative explaining the gap.
The FS-ISAC Threat Resilience Index uses 60 test cases mapped to prioritized ATT&CK techniques and returns a single Threat Resilience Metric. That metric can be trended quarter over quarter and compared against published industry benchmarks that reflect typical sector performance. Treat these benchmarks as floors rather than targets.
For board reporting, a red/amber/green (RAG) threshold model works well. Present the RAG summary on page one of the board report, with the underlying data available as an appendix for examiners.
The CISA Cybersecurity Performance Goals checklist provides a prioritized set of high-impact actions that map directly to several of these scorecard dimensions, making it a useful cross-reference when setting initial thresholds.
Which testing techniques validate your benchmark results?
Control-maturity self-assessments tell you what you have on paper. Testing tells you whether it works. The two are not interchangeable, and a benchmark program that relies entirely on self-assessment is not a benchmark program.
The main testing techniques and when to use each
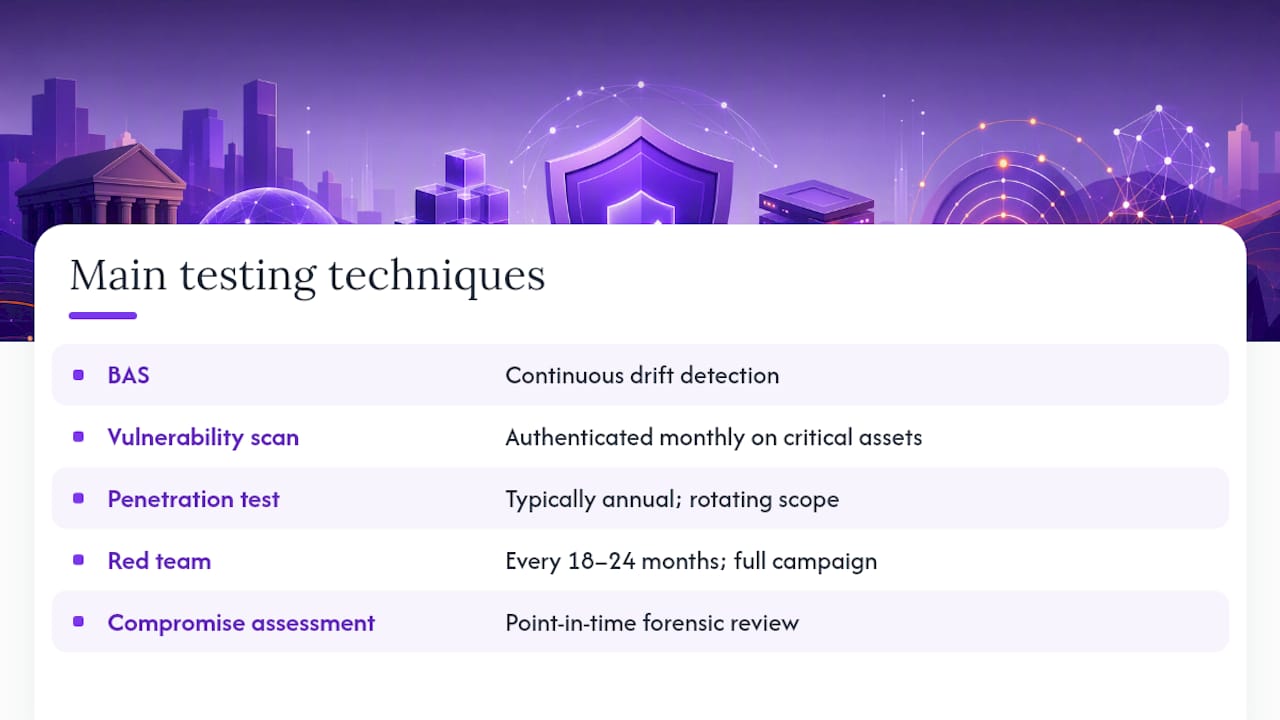
Breach-and-attack simulation (BAS) runs automated, continuous tests of your detection and prevention controls against a library of adversary techniques mapped to MITRE ATT&CK. BAS is best for continuous drift detection: catching when a configuration change or a new deployment breaks a control that was working last month. Picus is one of the established BAS vendors in this space, offering a platform that maps test results directly to ATT&CK technique coverage and produces prevention and detection scores you can trend over time.
Vulnerability scanning identifies known weaknesses in systems and applications. It is a prerequisite for patch management metrics and feeds directly into your remediation velocity KPIs. Run authenticated scans at least monthly on critical assets.
Penetration testing goes further than scanning by attempting to exploit identified vulnerabilities in a scoped, controlled engagement. A pen test answers the question: “Can an attacker actually get in?” It is typically annual for most supervised institutions, with scope rotating across different segments of the environment. Penetration testing feeds ISMS evidence and compliance documentation directly.
Red team exercises simulate a full adversary campaign, including social engineering, physical access attempts, and multi-stage attack chains. They are resource-intensive and typically run every 18–24 months for larger institutions. The output is a realistic picture of your resilience against a determined, sophisticated attacker.
Compromise assessments are point-in-time forensic reviews that look for evidence of existing compromise in your environment. They are particularly useful after a significant infrastructure change, a merger, or a period of elevated threat activity.
Disaster recovery and BCP testing validates your ability to resume critical operations after a disruption. The IOSCO assessment of financial market infrastructures recommends designing for resumption within two hours for critical functions, a target that most institutions should test against explicitly.
Pro Tip: When reviewing BAS results, a technique marked “blocked” without a corresponding SIEM or SOAR alert is a partial failure. Your prevention control stopped the technique this time, but your detection stack has no record of the attempt. In a real attack, that gap means your team would never know the technique was tried, and the attacker would simply pivot to a different approach. Log the block, alert on it, and close the detection gap.
The FS-ISAC Threat Resilience Index is intentionally difficult. Early adopters treat it as a prima facie test that reveals true operational gaps beyond what any self-assessment would surface.
How do benchmarks map to U.S. regulatory obligations?
Benchmarks are not a regulatory requirement in themselves, but they are the evidence layer that makes your regulatory compliance demonstrable. Here is how the major obligations connect.
FTC Safeguards Rule
The FTC Safeguards Rule requires covered financial institutions to maintain a written information security program with specific elements: a risk assessment, designed and implemented safeguards, regular testing of those safeguards, an incident response plan, and a written report to the board or Qualified Individual at least annually. The 2021 revision and 2023 amendments added concrete requirements for MFA, encryption, and breach notification timelines (effective May 2024 for specified notification requirements). A benchmark scorecard maps directly to the “testing” and “board reporting” elements of the Safeguards Rule.
FFIEC and GLBA
FFIEC examination guidance expects institutions to demonstrate a risk-based approach to cybersecurity, with evidence of control testing and a documented process for addressing gaps. GLBA’s Safeguards Rule (the FTC version applies to non-bank financial institutions; the banking agencies have their own parallel requirements) sets the same general program structure. Examiners increasingly reference the CRI Cyber Profile as an acceptable assessment methodology.
SEC guidance
SEC-registered investment advisers and broker-dealers face cybersecurity disclosure and program requirements under Regulation S-P and, for larger registrants, the SEC’s cybersecurity disclosure rules. Benchmark outputs that document your risk assessment process, control testing, and incident response readiness are directly relevant to these obligations.
| Framework | Regulator alignment | Evidence supervisors want |
|---|---|---|
| CRI Cyber Profile | OCC, FDIC, Fed, FFIEC | Completed diagnostic statements, impact tier rationale, remediation backlog |
| NIST CSF | FFIEC, FTC, SEC | Current and target profiles, gap analysis, testing results |
| CIS Controls | CISA, FTC Safeguards Rule | IG implementation percentage, vulnerability scan results, patch SLA data |
| ISO 27001 | GLBA, FTC Safeguards Rule, third-party risk | Certification scope, audit findings, corrective action records |
| PCI DSS | PCI Security Standards Council, card brands | ROC or SAQ, penetration test report, compensating control documentation |
Documentation to retain for exams
Examiners will ask for specific evidence. Keep the following in a retrievable, dated format:
- Asset inventory with classification and data flow maps
- Impact tier assignment with documented rationale
- Completed diagnostic statement responses with evidence pointers
- Threat-driven test results (BAS reports, pen test reports, FS Index scores)
- Vulnerability scan results and patch SLA tracking
- Remediation tickets with open/closed dates and owner assignments
- Board or Qualified Individual reports with dates of delivery
- Incident response plan and tabletop exercise records
- Breach notification records and timelines (for FTC Safeguards Rule compliance)
For breach response specifically, having a documented playbook and evidence of tabletop exercises is increasingly a baseline examiner expectation. A data breach response guide tailored to financial ISMS requirements can help structure that documentation.
The IOSCO assessment found that a majority of financial market infrastructures reference public cyber guidance and use metrics and testing to improve resilience, which reflects the direction supervisors are moving: away from checklist compliance and toward evidence-based performance measurement.
What tools and benchmark sources do security teams actually use?
The tooling landscape for financial-sector benchmarking spans several categories, and the right combination depends on your assessment goals.
Sector benchmark indexes and profiles. The FS-ISAC Threat Resilience Index (FS Index) is the primary threat-driven benchmark for financial institutions. The CRI Cyber Profile is the primary governance and control-maturity benchmark. The ABA Financial Services Sector Cybersecurity Profile serves community institutions. These are your primary measurement sources, not tools in the software sense.
CIS Benchmarks. CIS publishes hardening benchmarks for specific platforms (Windows Server, Linux, AWS, Azure, Kubernetes) that your engineering teams can apply directly. CIS-CAT Pro automates compliance checking against these benchmarks and produces scored reports.
BAS vendors. Picus and similar platforms run continuous adversary-simulation tests against your security controls and map results to ATT&CK. The output feeds your detection and prevention scores directly. Most BAS platforms also produce remediation recommendations tied to specific control gaps.
GRC platforms. GRC tools (ServiceNow GRC, OneTrust, Archer, and others) manage the diagnostic statement workflow, evidence library, and remediation backlog. They are the connective tissue between your assessment outputs and your governance reporting.
SIEM and SOAR. Your SIEM is both a data source for benchmark metrics (log coverage, alert volume, MTTD) and a validation target for BAS tests. SOAR platforms automate response workflows and produce the response-time data your scorecard needs.
Vulnerability scanners. Tenable Nessus, Qualys, and Rapid7 InsightVM are the common choices. Authenticated scans produce the asset coverage and CVE data that feed your patch SLA metrics.
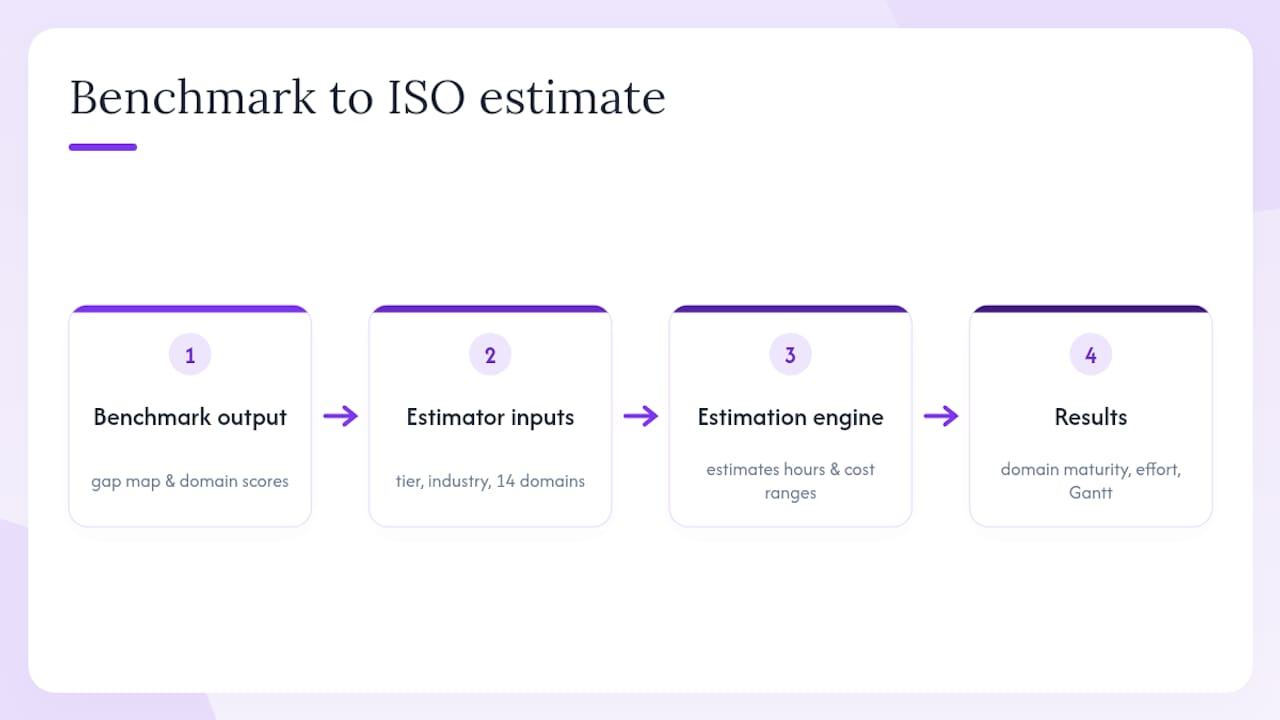
ISO effort estimation tools. Once your benchmark gaps are mapped, translating them into an ISO 27001 implementation plan requires effort and cost estimates by domain. Ismscalculator provides a real-time calculator that takes your institution’s size, industry, and maturity level as inputs and produces domain-by-domain effort estimates, cost ranges, and a Gantt timeline. That output is directly useful for budget requests and board presentations.
A practical integration pipeline: BAS platform identifies a detection gap → SIEM confirms no alert was generated → GRC ticket created with ATT&CK technique reference → remediation assigned to SOC engineering → scorecard updated when ticket closes. That chain produces auditable evidence at every step.
Selection criteria for any tool in this stack:
- Does it produce evidence with timestamps and provenance that an examiner can verify?
- Does it map outputs to the frameworks your supervisors reference (NIST CSF, CRI, CIS)?
- Can it automate evidence collection, or does it require manual attestation?
- Does it support role-based access so evidence cannot be altered after collection?
- Can it export reports in formats your board and examiners can read without specialized software?
For a broader review of risk assessment platforms suited to financial organizations, the selection criteria above apply across the category.
How Ismscalculator turns benchmark outputs into ISO 27001 estimates
Once you have completed a benchmark cycle, you have something more valuable than a compliance checkbox: a gap map. You know which domains are underperforming, which controls are missing, and roughly how much remediation work sits in your backlog. The next question is what it will cost to close those gaps and whether ISO 27001 certification is a realistic near-term goal.
That is exactly the problem Ismscalculator is built to answer.
Benchmark outputs feed directly into Ismscalculator’s estimation engine. Your impact tier, industry classification, and control-maturity scores across the four Annex A control themes become the inputs. The platform returns estimated implementation effort in hours, cost ranges calibrated to your institution’s size, a domain-by-domain maturity assessment, and a customizable Gantt chart showing a realistic implementation timeline. For a compliance officer preparing a board budget request, that output takes a benchmark gap analysis and turns it into a defensible number.
The free 2-minute readiness check is a practical first step. It takes your basic parameters and returns an instant estimate of where your ISO 27001 readiness stands and what a realistic implementation budget looks like. For teams that have just completed a first benchmark cycle and are trying to prioritize remediation spend, it functions as a quick budget sanity check before committing to a full scoping engagement.
Consider a scenario that plays out regularly: a mid-size bank completes its first CRI Cyber Profile assessment and discovers that its logging and monitoring domain scores significantly below its target maturity level. The gap is real, but the remediation cost is unclear. Running those findings through Ismscalculator’s domain-level estimator surfaces the effort required for the logging and monitoring domain specifically, which lets the CISO present a scoped budget request rather than a vague “we need more security investment” ask. The board approves faster because the number is grounded in a recognized methodology.
Pro Tip: Use Ismscalculator’s multi-estimate comparison feature to model two scenarios: one where you close only the critical gaps identified in your benchmark, and one where you pursue full ISO 27001 certification. The cost delta between those two paths often makes the case for certification on its own, because the incremental effort to go from “gaps closed” to “certified” is smaller than most boards expect.
What does a 90-day to 12-month remediation roadmap look like?
Benchmark gaps do not close themselves, and a remediation backlog without a timeline is just a list of problems. Here is a practical sequencing model.
90-day quick wins
The first 90 days should focus on high-impact, low-effort controls that directly affect your threat-resilience score and your examiner readiness:
- Enable MFA on all privileged accounts and remote access entry points (FTC Safeguards Rule requirement; also a top CIS Control).
- Expand SIEM log coverage to 95% of critical assets. Identify which assets are not sending logs and fix the collection gap.
- Run a vulnerability scan on all internet-facing systems and remediate critical CVEs within 15 days.
- Complete your asset inventory and data flow maps if they are not current.
- Assign ownership for each open diagnostic statement in your CRI or NIST assessment.
6-month structural fixes
Months 3–6 address the structural gaps that require engineering effort or vendor coordination:
- Implement endpoint detection and response (EDR) across all in-scope endpoints.
- Deploy or tune SIEM alert rules to cover the top 20 ATT&CK techniques relevant to financial-sector threat actors.
- Complete Tier 1 vendor assessments and remediate any critical findings.
- Conduct a penetration test on your highest-risk environment segment and track findings to closure.
- Formalize your incident response plan and run a tabletop exercise. Document the results for examiner review.
- Establish a quarterly board reporting cadence with a RAG scorecard.
12-month program work
The 12-month horizon is for program-level investments that require budget approval, procurement, and sustained effort:
- Implement a GRC platform to automate evidence collection and remediation tracking.
- Run a full BAS engagement and establish a continuous validation cadence.
- Complete a full CRI Cyber Profile or NIST CSF assessment cycle with third-party validation.
- Launch an ISO 27001 implementation project if certification is a strategic goal, using your benchmark gap map as the input to scope and timeline planning.
- Establish a third-party risk management program with tiered assessment requirements for all vendors.
Governance actions by timeframe:
- 90 days: CISO presents initial benchmark scorecard to board or Qualified Individual. Remediation backlog approved with budget.
- 6 months: First quarterly board report delivered. Pen test findings reviewed by board risk committee.
- 12 months: Full assessment cycle complete. ISO 27001 implementation plan (if applicable) presented with cost estimate and timeline.
Priority sequencing for remediation: logs and detection first, then identity and access management, then third-party remediation, then incident response and resilience. That order reflects the controls that most directly affect your threat-resilience score and your examiner readiness.
For a detailed ISMS implementation plan tailored to financial institutions, the sequencing above maps directly to the implementation phases.
Where financial sector benchmarks are headed
The shift Deloitte’s research describes, with financial-sector CISOs moving cybersecurity from a purely technical discipline into a business-strategic role, is already visible in how examiners conduct conversations. Five years ago, an examiner wanted to see a policy. Today, they want to see a scorecard with trend data and a remediation backlog with dates.
A few signals worth watching:
- Impact-tier adoption will become mandatory in supervisory guidance. The CRI Cyber Profile’s tiering model is already referenced in FFIEC examination materials. Expect formal supervisory expectations around tier assignment and proportionate assessment depth within the next two to three examination cycles.
- Continuous validation will replace point-in-time testing for larger institutions. BAS platforms running monthly or quarterly against a defined ATT&CK technique set are becoming the norm at Tier 1 and Tier 2 institutions. Annual pen tests will remain, but they will be supplemented rather than replaced.
- Third-party benchmark requirements will tighten. Concentration risk in core banking and cloud providers is a supervisory priority. Expect regulators to push for standardized vendor assessment questionnaires tied to impact tiers, reducing the current fragmentation where every institution sends a different questionnaire to the same vendor.
- Evidence-based supervisory expectations will expand. The IOSCO finding that most financial market infrastructures already use metrics and testing to measure resilience reflects where the sector is heading. Institutions that can show trended performance data, not just point-in-time attestations, will have materially smoother exam conversations.
The practical implication: build your benchmark program around evidence provenance from day one. Every test result, every diagnostic statement response, every remediation ticket should carry a timestamp and an owner. That discipline pays dividends when an examiner asks for trend data three years from now.
Ismscalculator: from benchmark gaps to ISO 27001 budget in minutes
Completing a benchmark cycle leaves you with a detailed gap map and a remediation backlog. Converting that into a budget request and an ISO 27001 implementation timeline is where many compliance teams stall, not because the work is unclear, but because the cost and effort estimates are hard to produce without a structured tool.
Ismscalculator is built specifically for that translation. Enter your institution’s size, industry, and the maturity scores from your benchmark assessment, and the platform returns a domain-by-domain effort estimate, a cost range, and a Gantt timeline you can export as a PDF and share with your board. The ISO 27001 readiness assessment takes your benchmark outputs and produces a scoped implementation plan with the detail a board needs to approve a budget.
For teams that want a quick sanity check before committing to a full scoping engagement, the free 2-minute readiness check returns an instant estimate based on your basic parameters. It takes two minutes and gives you a defensible starting number for your next board conversation.
Sources
The sources below are the primary references for this article. Which one to read first depends on your role:
- FTC Safeguards Rule: What Your Business Needs to Know | Federal Trade Commission
- NIST Cybersecurity Framework (CSF)
- CISA: Cybersecurity Performance Goals checklist
- IOSCO: Assessment of cyber resilience of FMIs (summary)